Title here
Summary here
Forq comes with a built-in Admin UI that allows you to monitor and manage your message queues through a user-friendly web interface. It is built with HTMX and DaisyUI, ensuring a responsive and interactive experience.
To pay tribute to the HTMX lore, I have to mention that Forq Admin UI is implemented by the CEO of HTMX himself.
By default, the Admin UI is accessible at http://localhost:8081 (or the address you specified in the FORQ_UI_ADDR environment variable).
Admin UI consists of 3.5 pages. I’ll go through each of them in detail.
There is one thing I’d like to mention first: if your Forq instance will get a decent traffic, and you are going to use Admin UI extensively, the chances are that at some point UI might become slightly slower while loading the data.
It’s not a bug, though, but a trade-off I had to make: the DB queries are optimized for the API, not for the UI. Some of them would have benefited from additional indexes, but that would have made the write operations slower, which is not worth it, imho.
Look at this beauty:
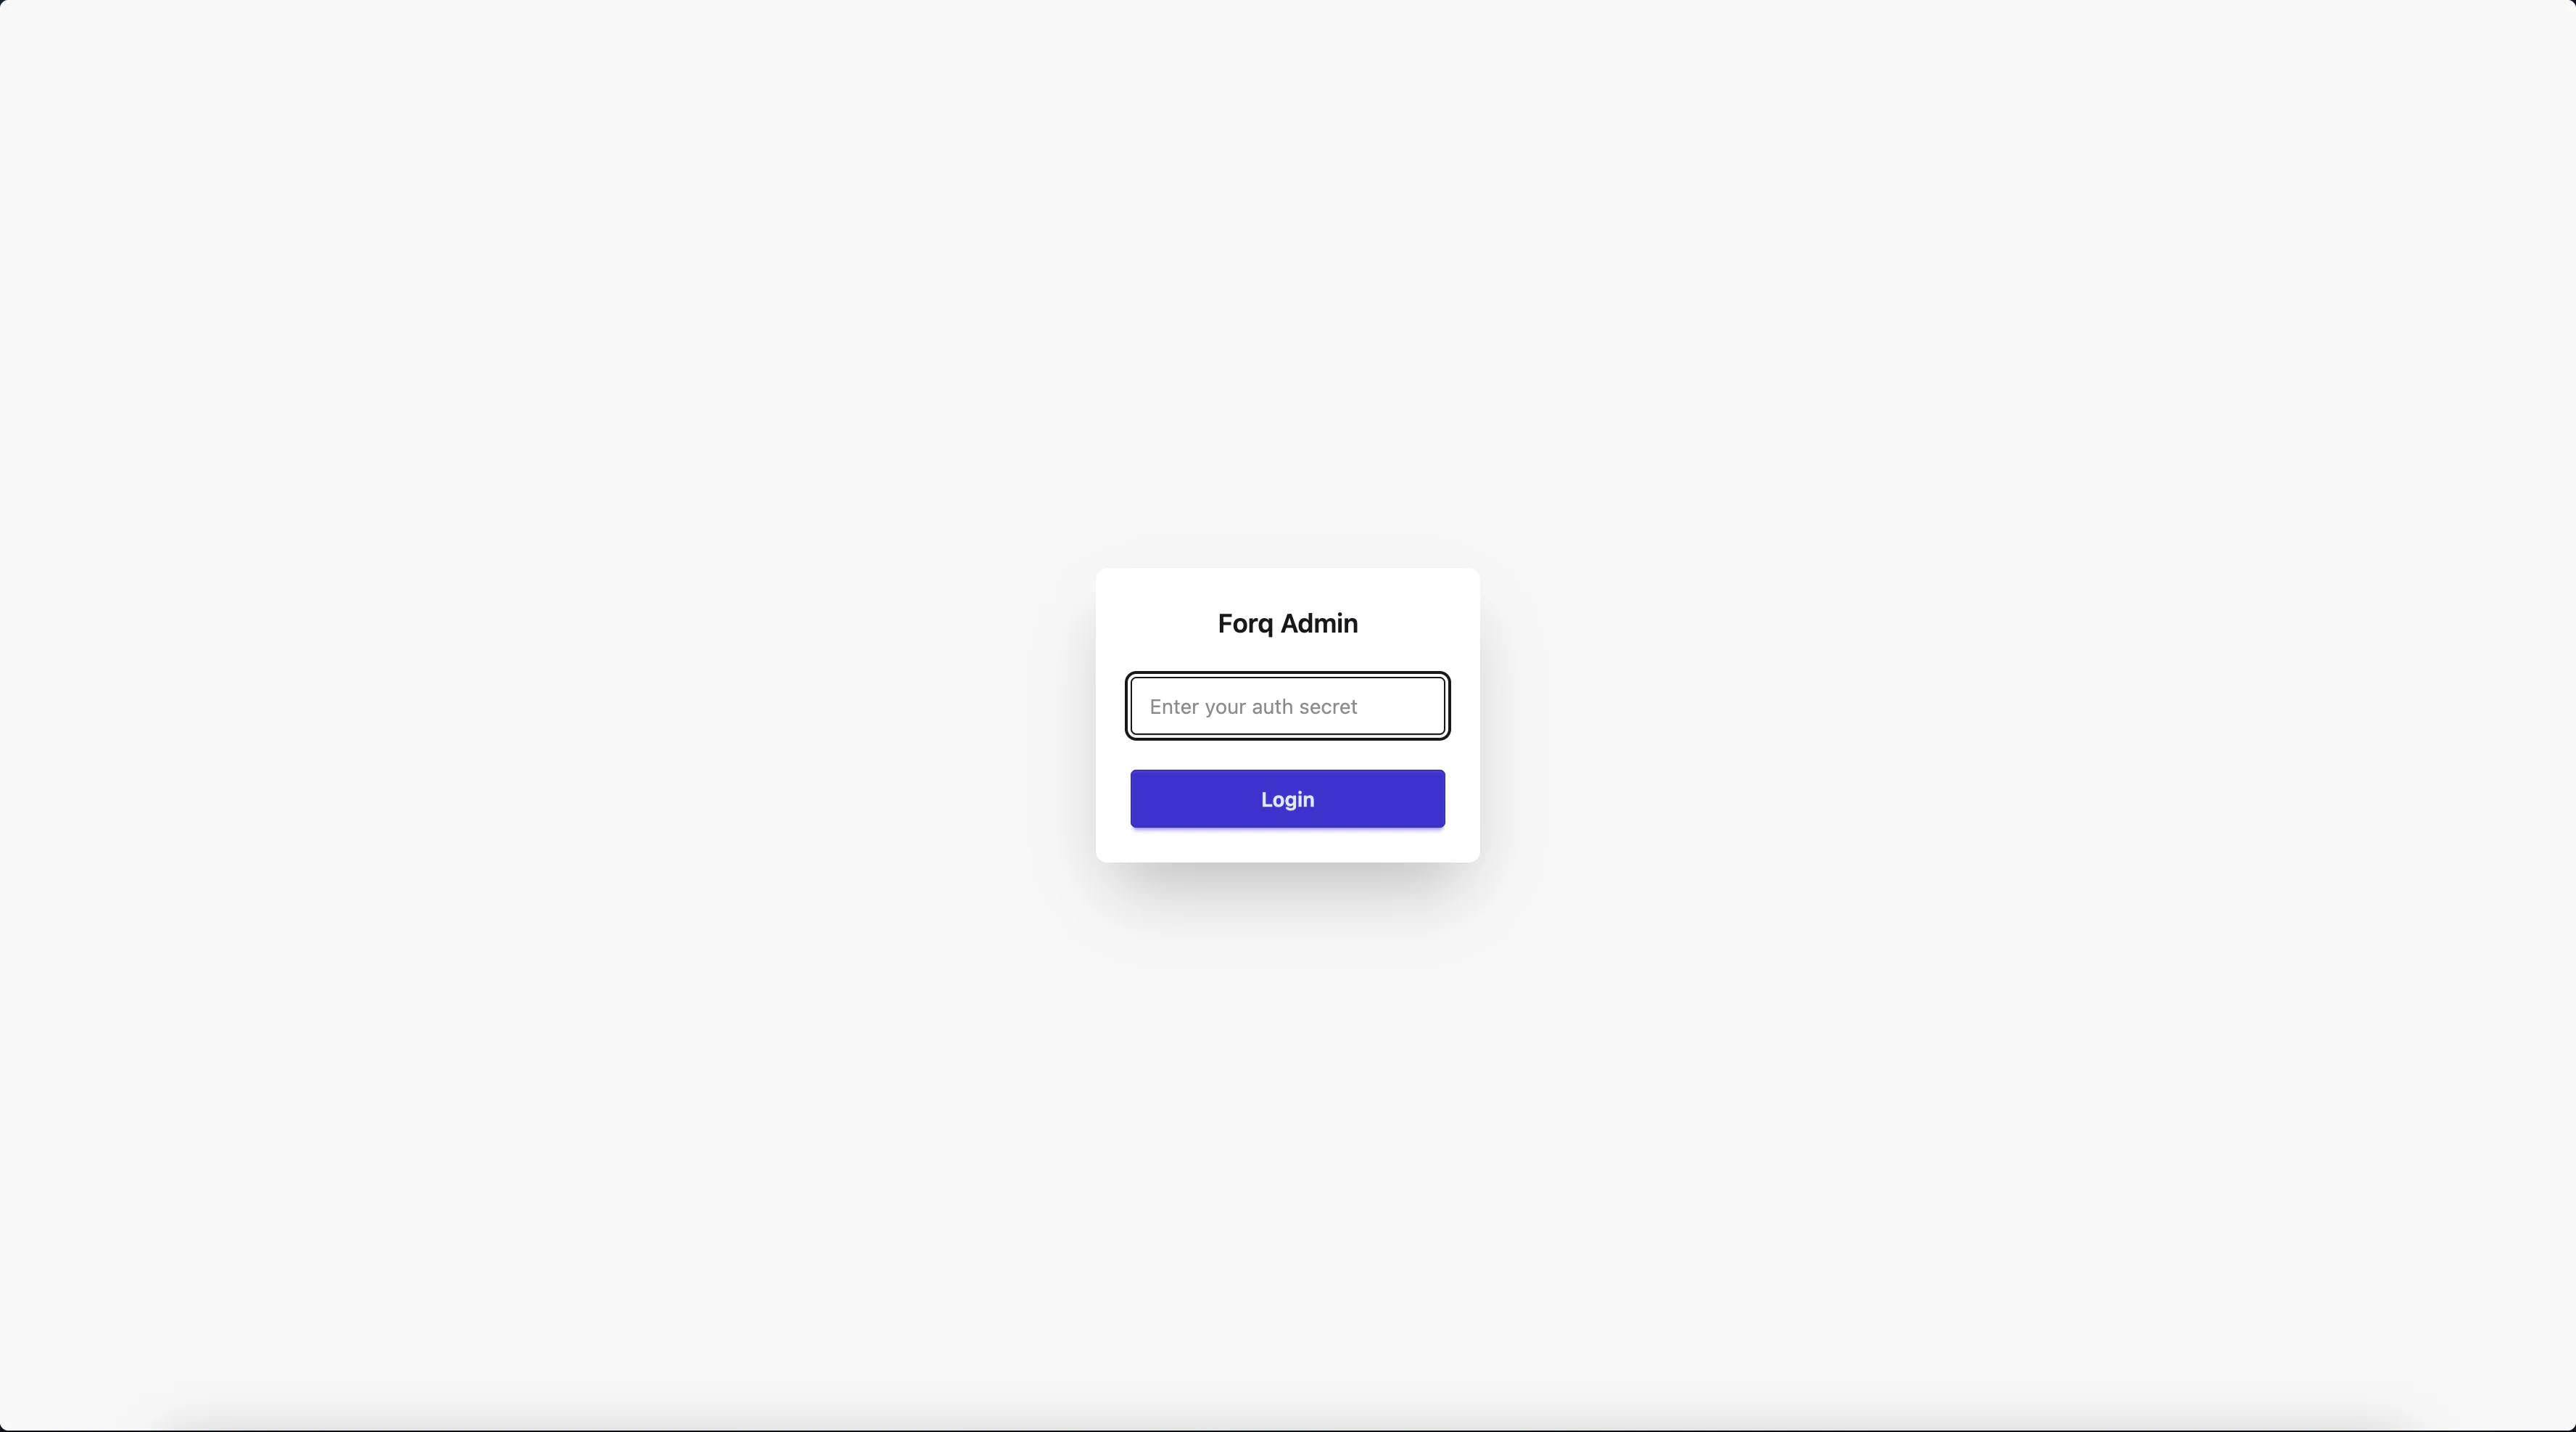
You need to log in using the FORQ_AUTH_SECRET you set in your environment variables.
Forq will create a session for you, so no need to enter the secret every time. The session is stored in-memory, so if you restart Forq, you’ll need to log in again. Annoying, I know, but I decided to keep SQLite busy with messages only for performance reasons.
Once you are in, you will see the dashboard:
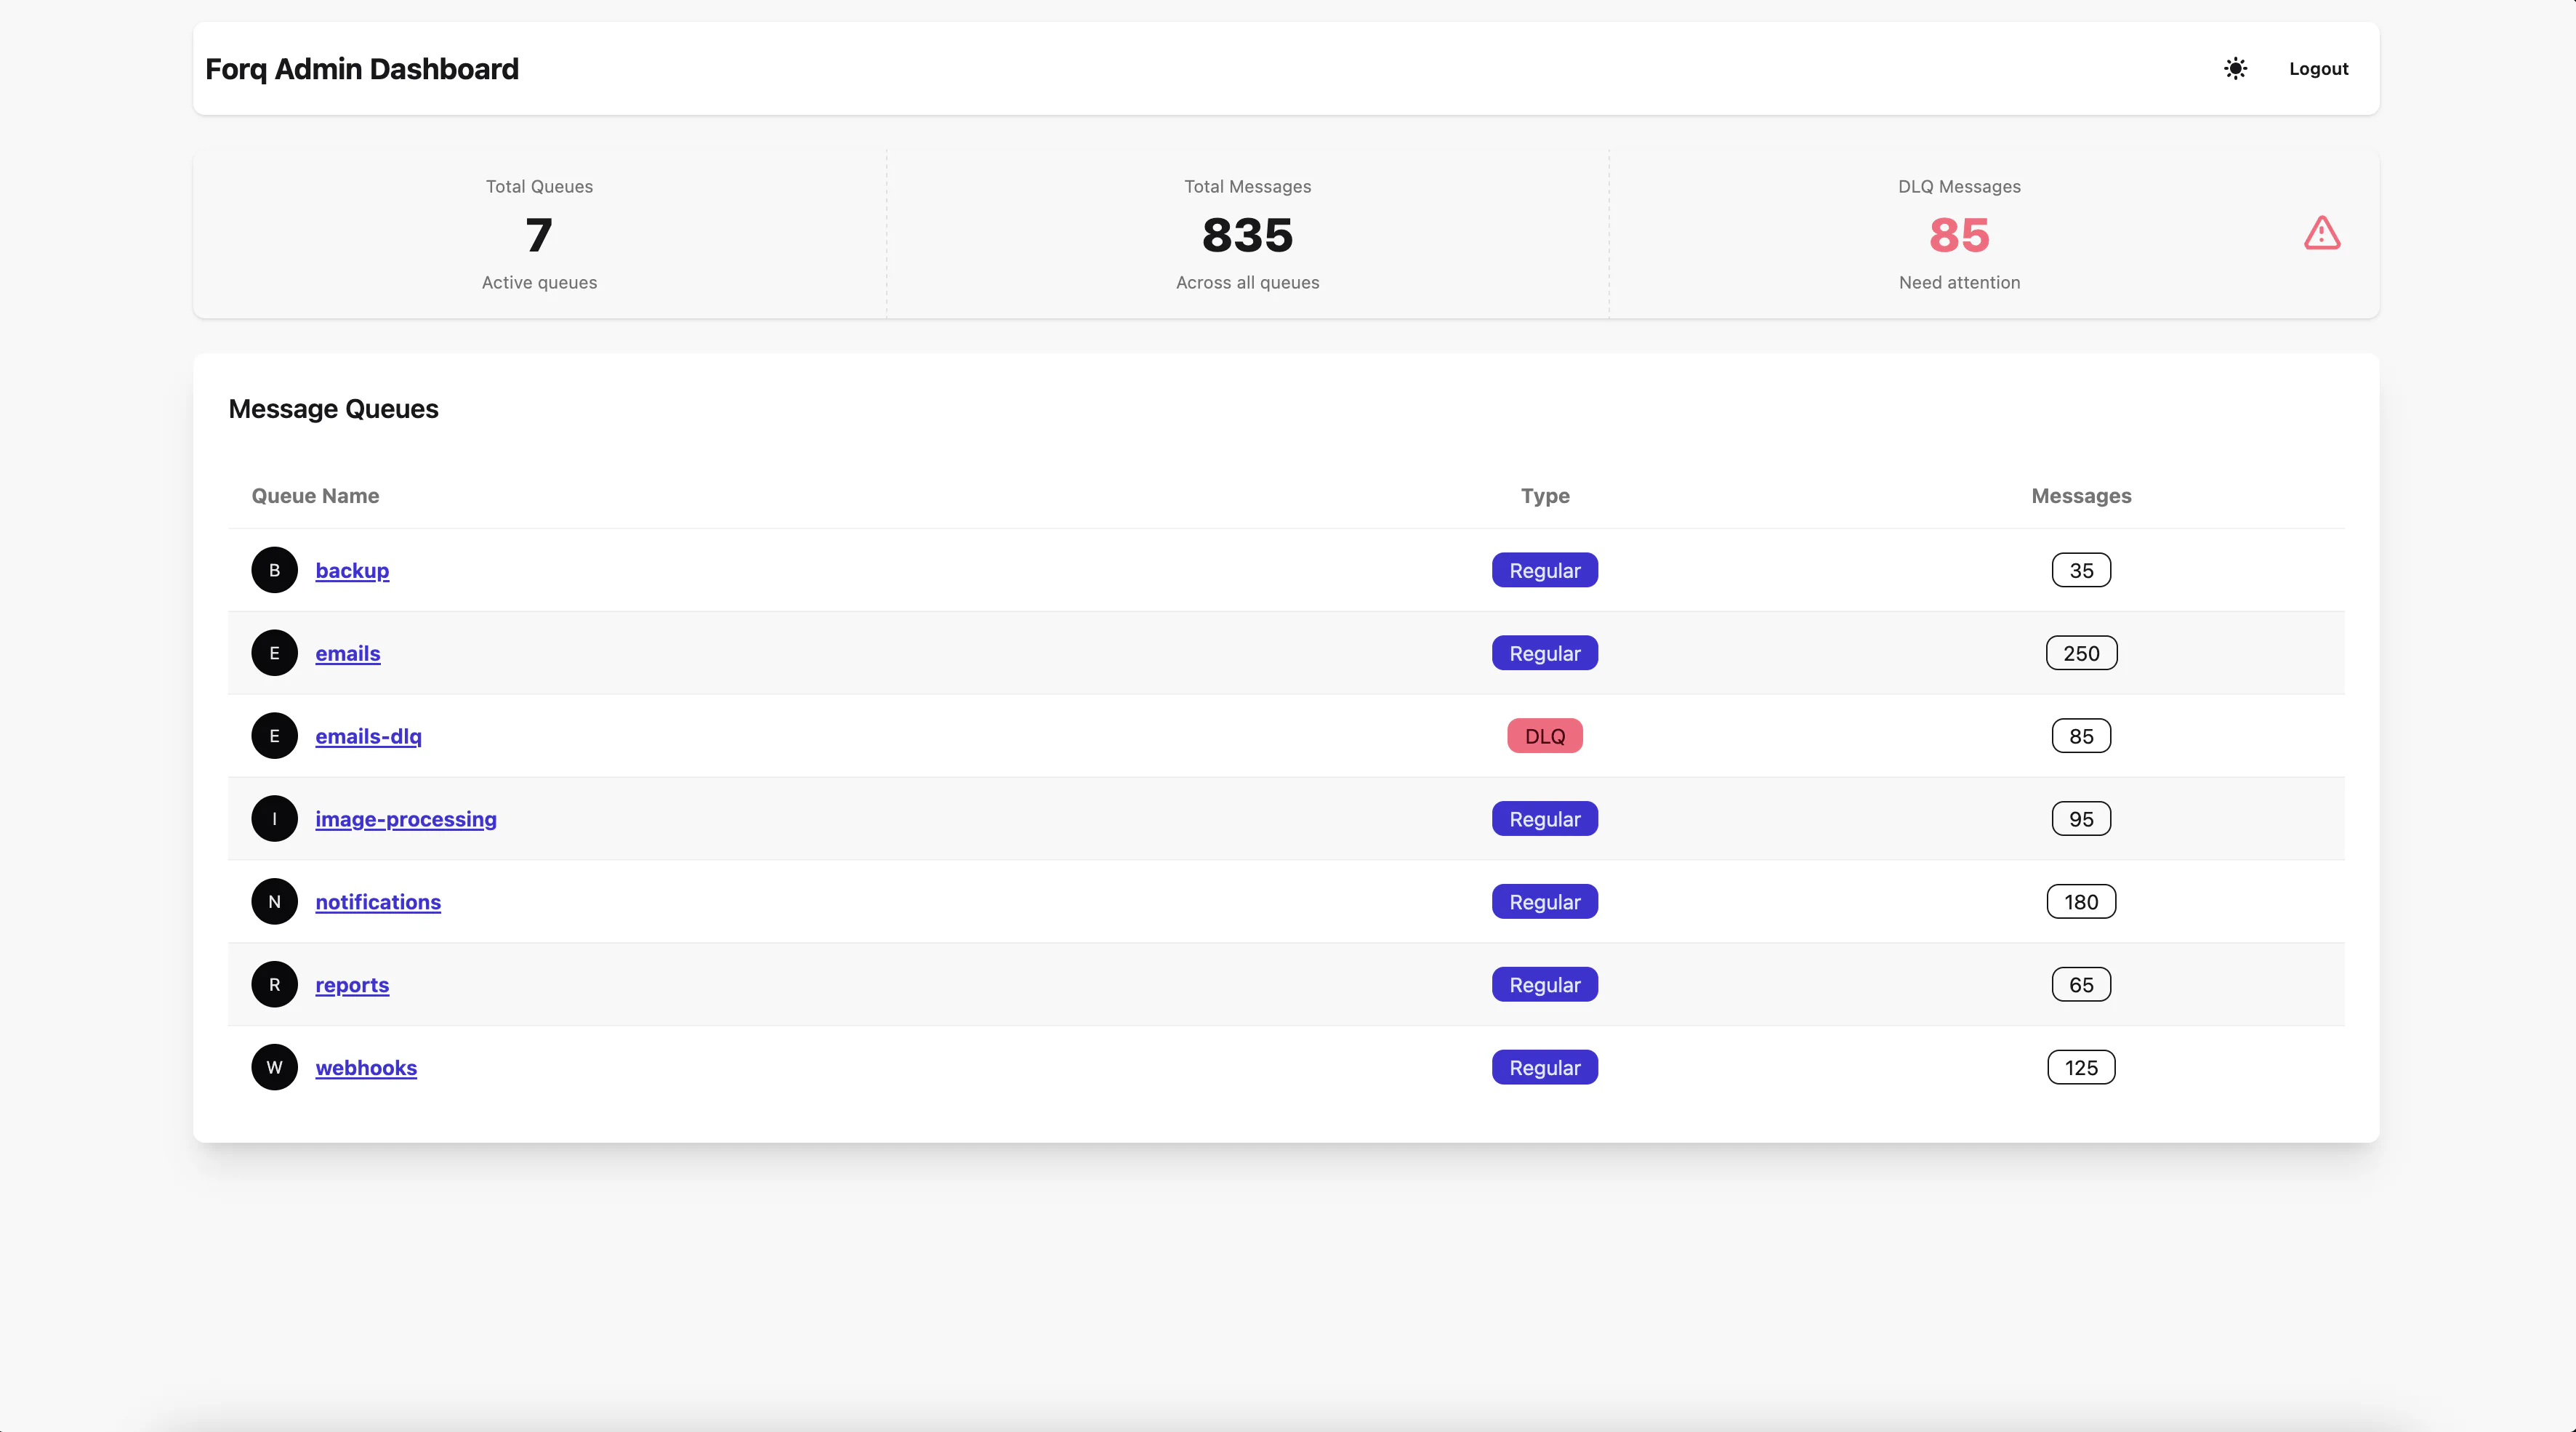
It even supports dark mode, see the top-right corner next to Logout button.
As you can see, the dashboard provides an overview of your queues, including:
You can click on a queue name to view its details.
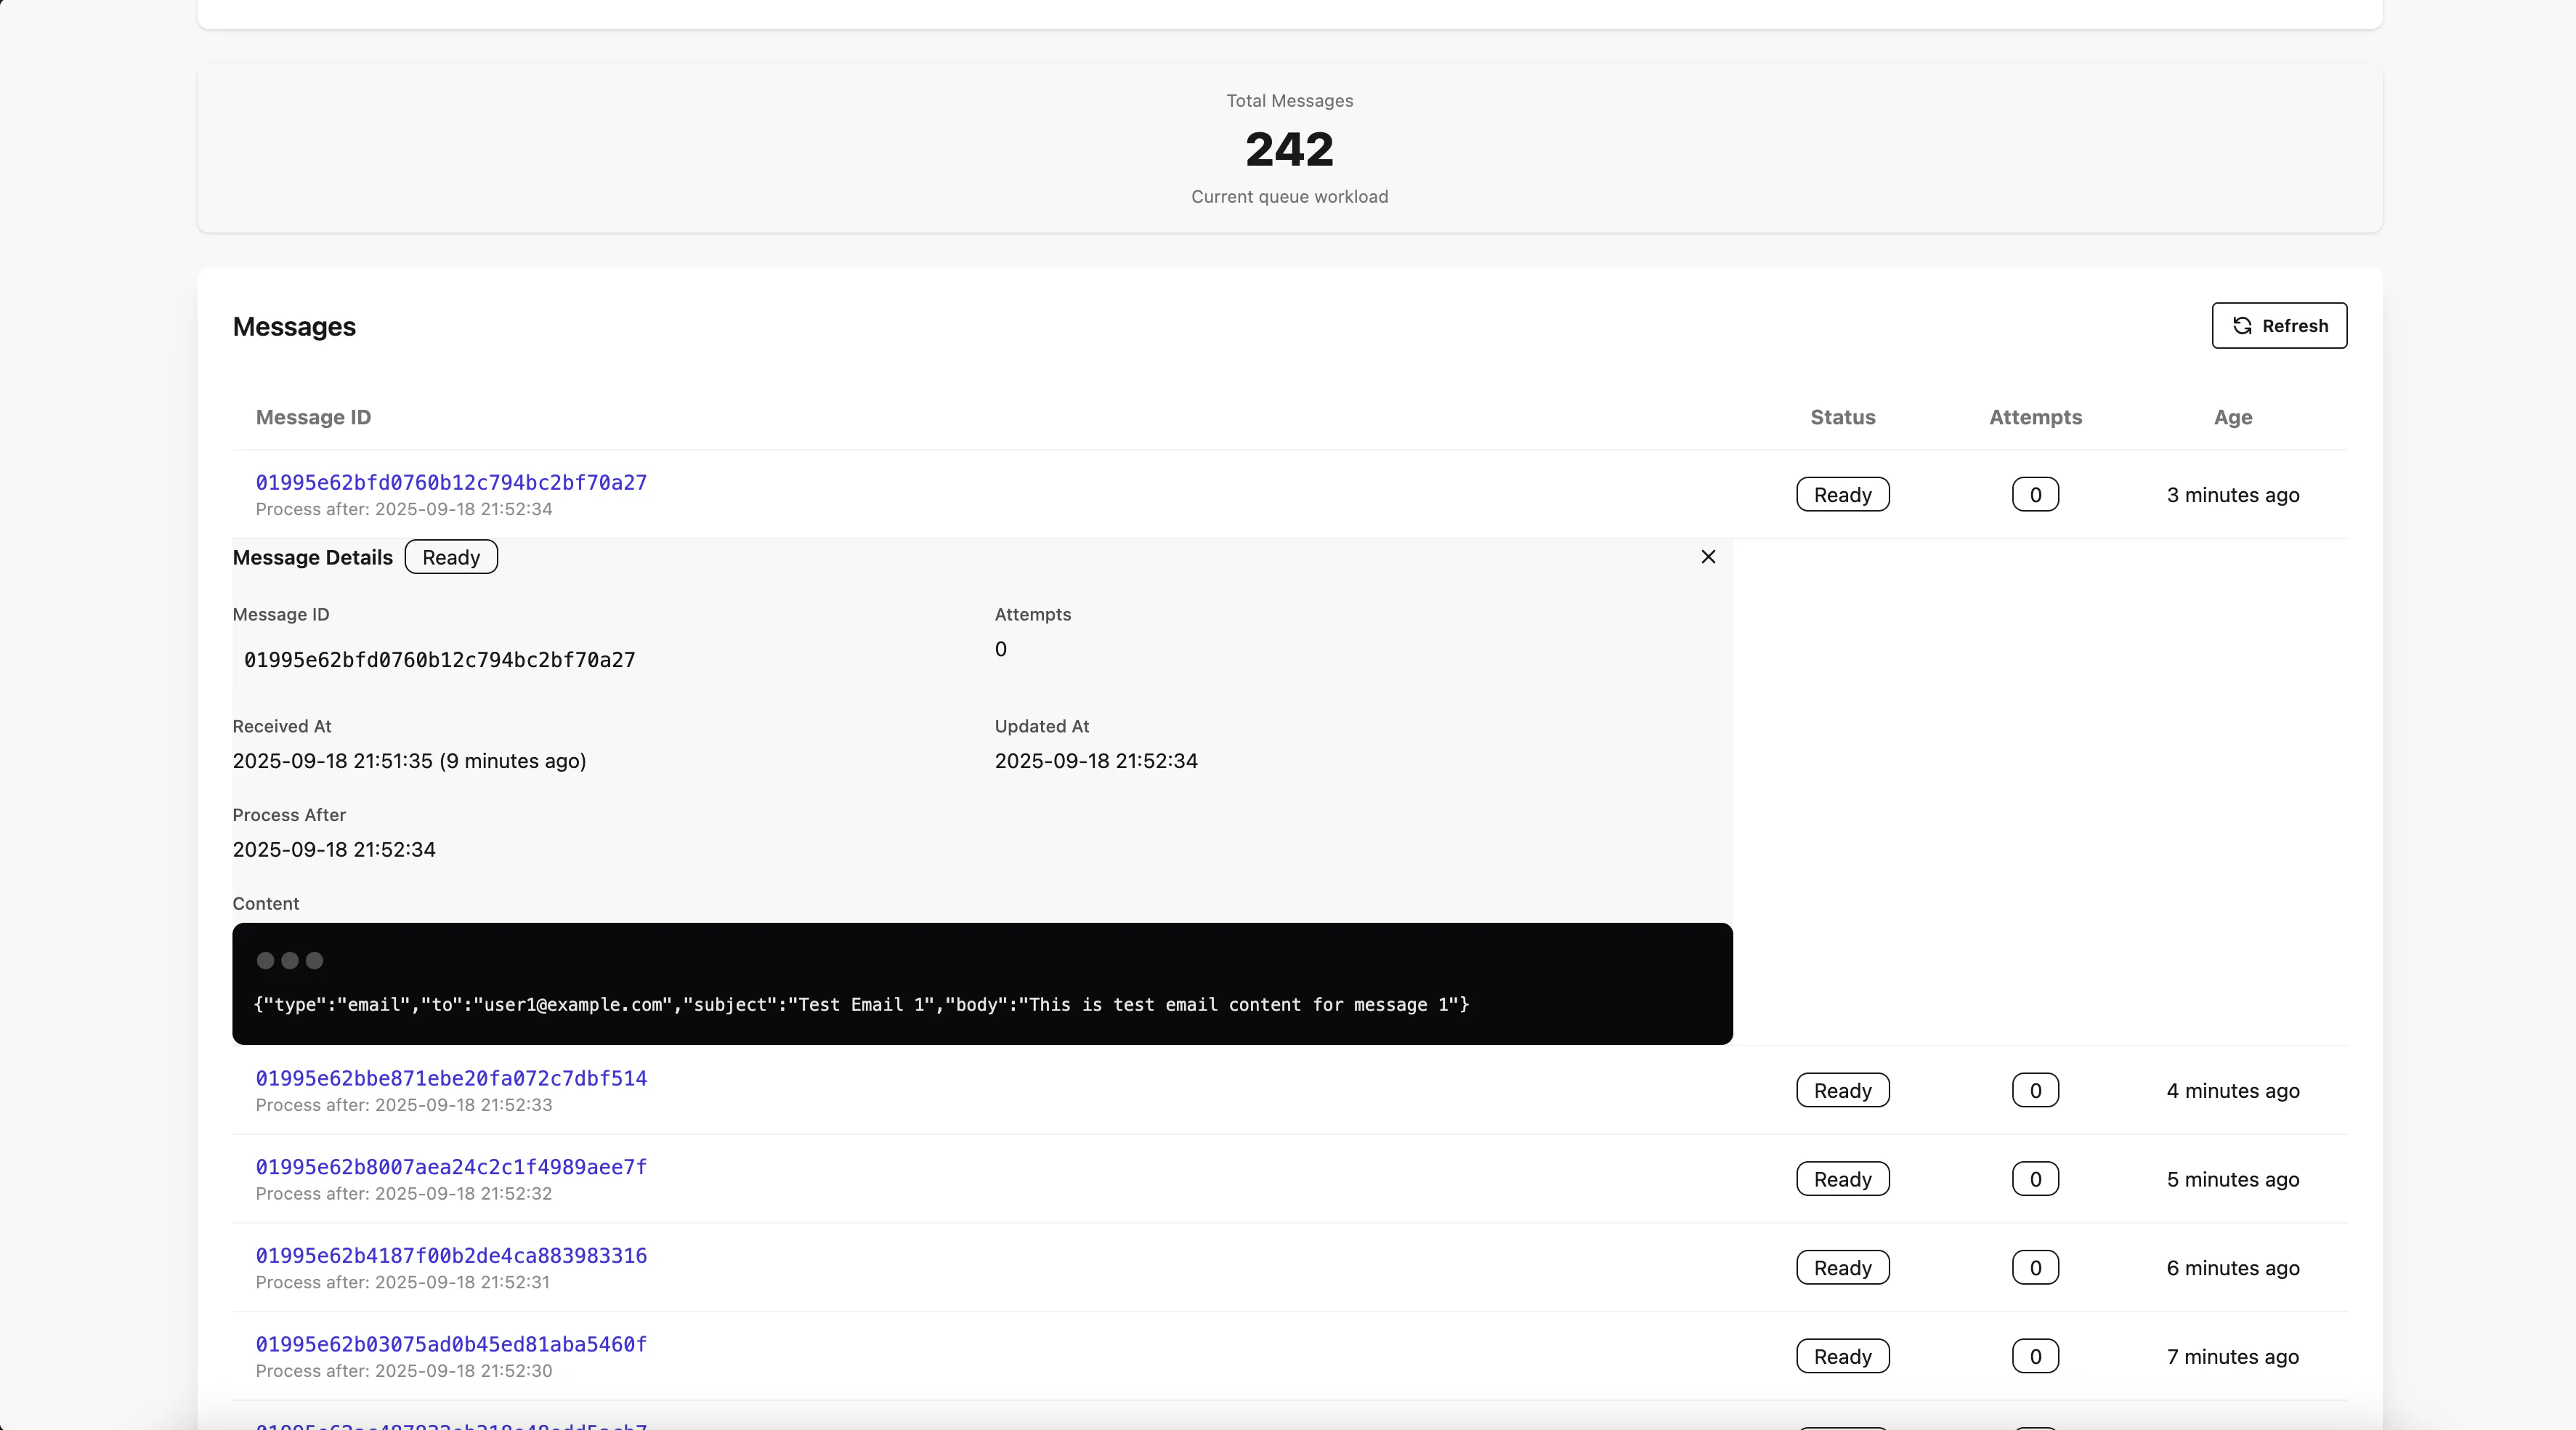
When you click on a queue name, you will be taken to the queue details page:
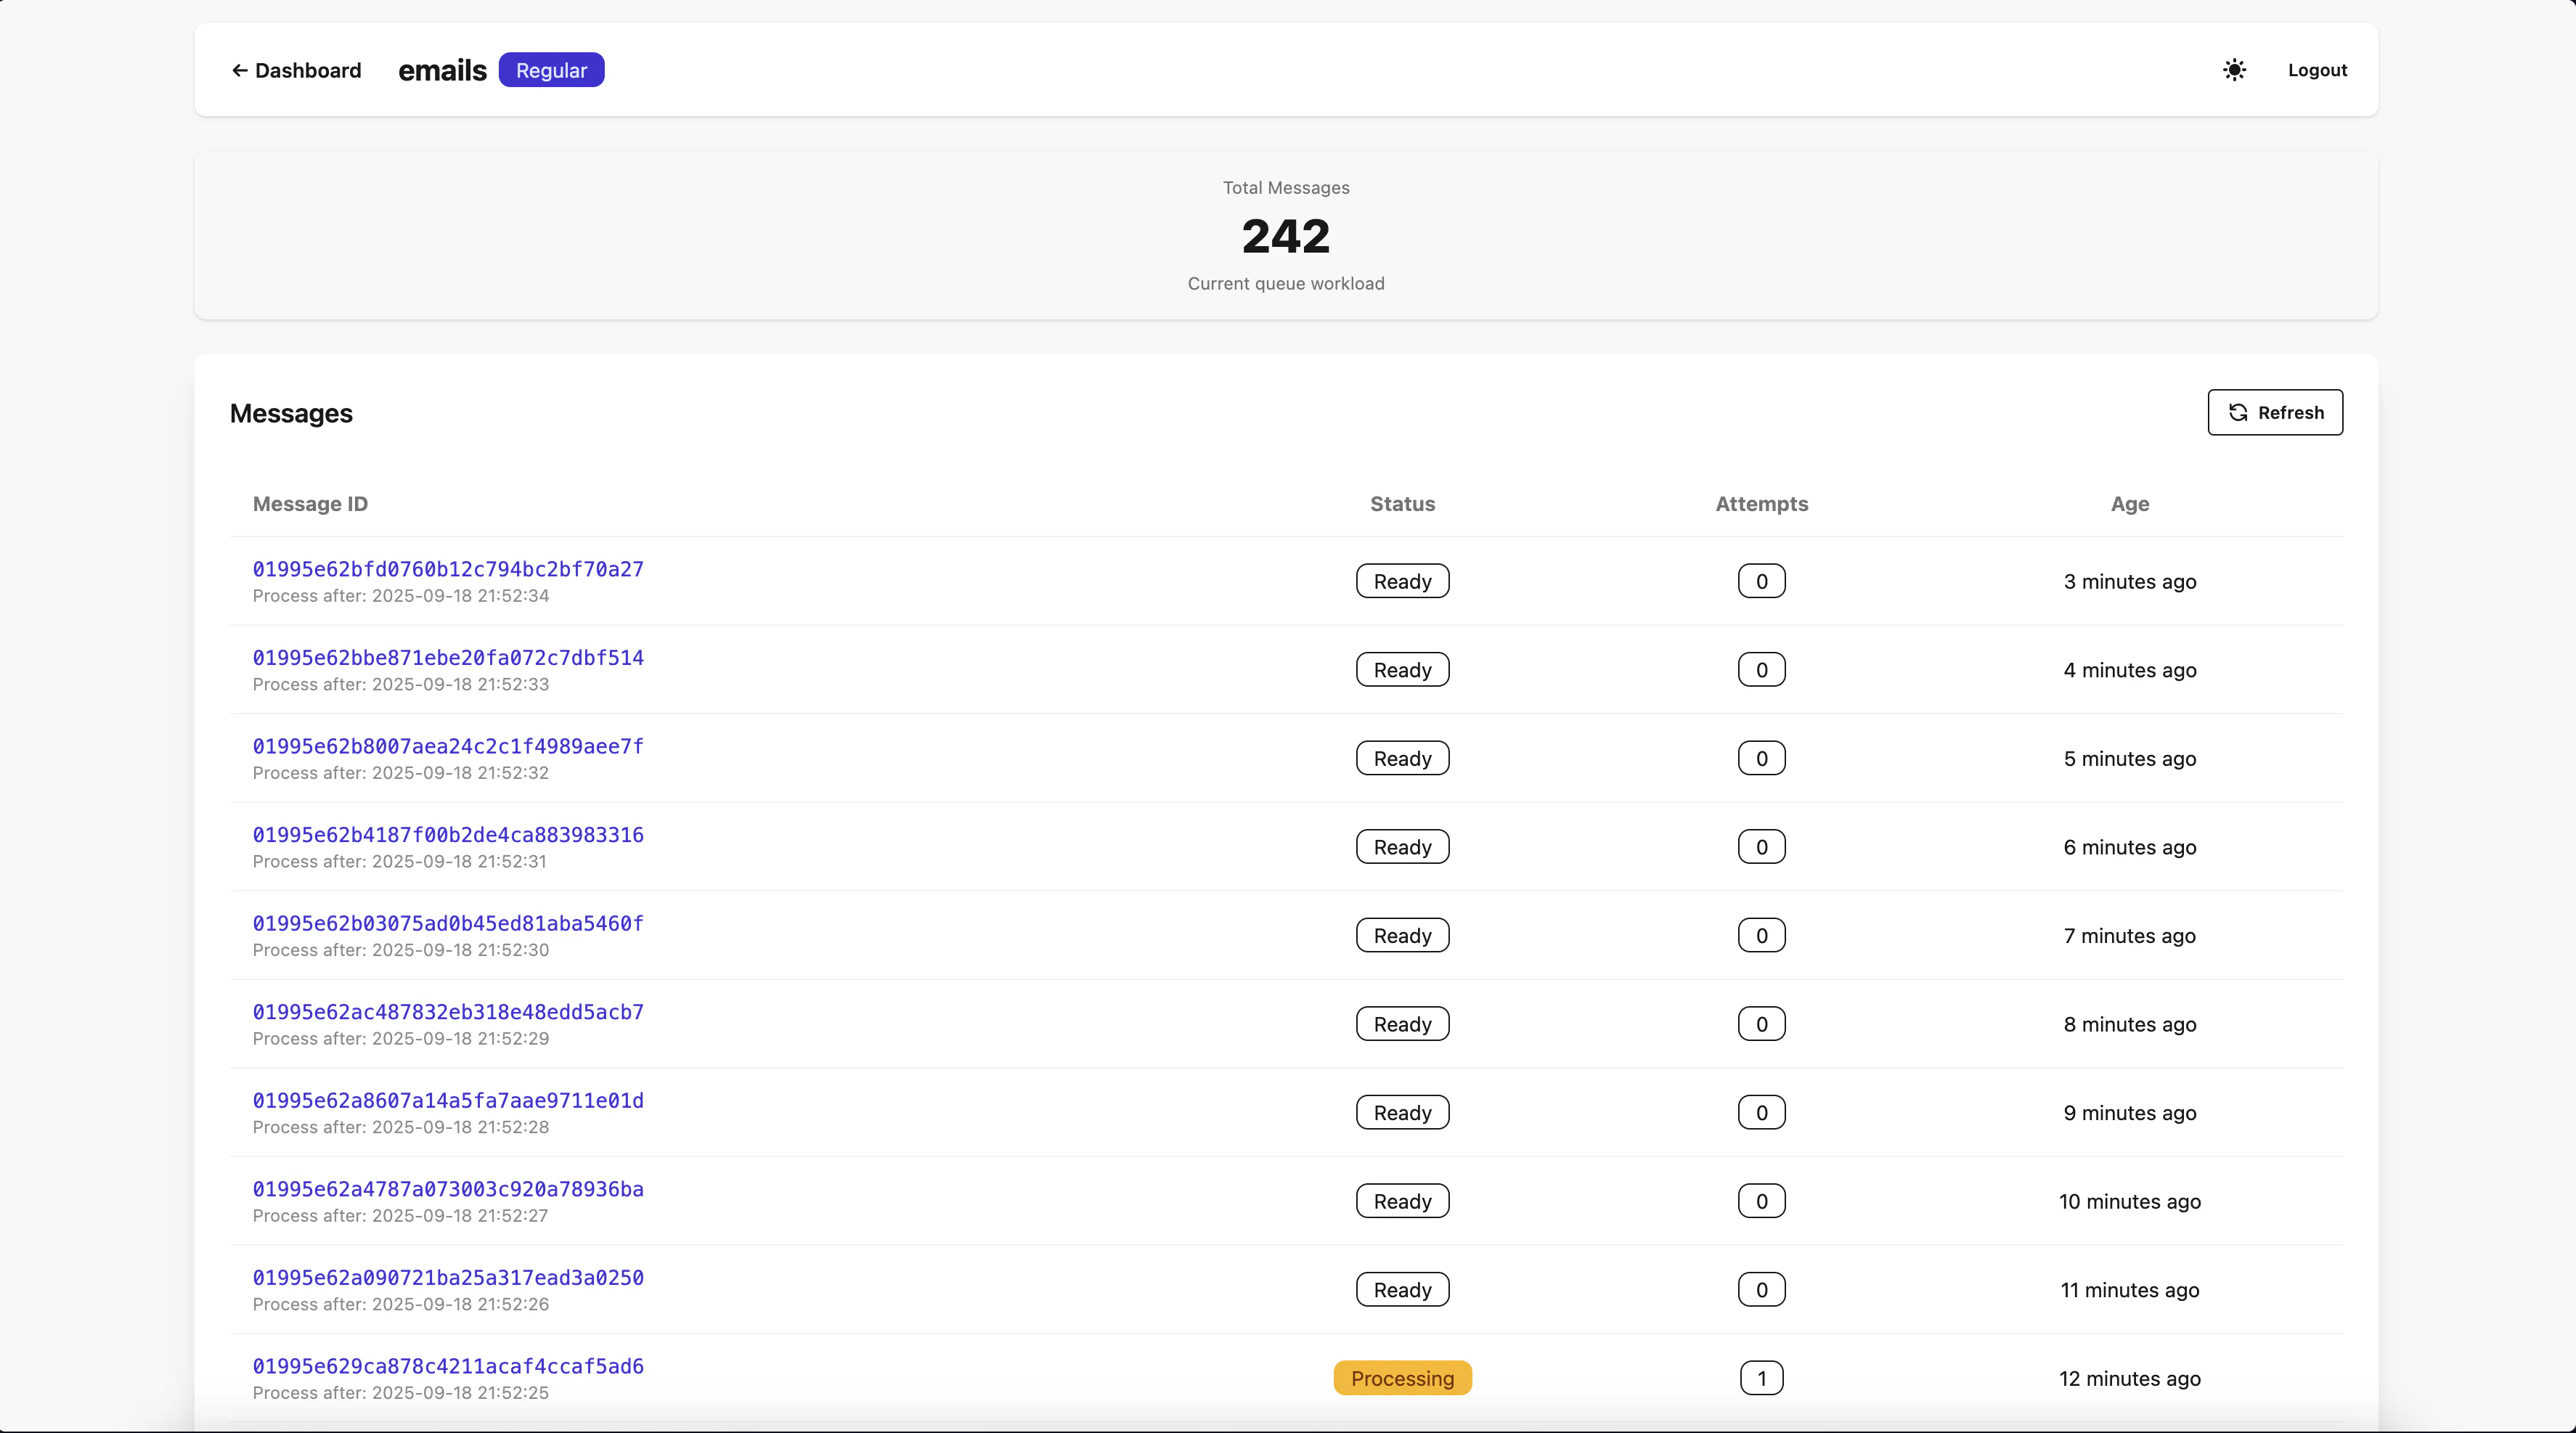
Here you can see:
The content of the messages are not loaded here for performance reasons, but you can click on a message ID to view its details.
The status can be:
ReadyProcessingFailedThe messages are sorted by age from the newest to the oldest. The first 50 messages are loaded, and you can load more by scrolling down.
Please, note the the pagination on scroll is implemented in a way, that the order of messages is preserved, but no newly added messages are shown until you refresh the page or click the “Refresh” button. Otherwise, this would be a nightmare to implement and to use UX-wise. It can still be quite bad if your consumers are super-fast (as they should be). The initial idea was to use this page for viewing DLQs mainly, where new messages are not added that often.
You can click on a message ID to view its details that will be shown on the same page below the message of choice.
Let’s take a look at the Queue Details page for DLQs.
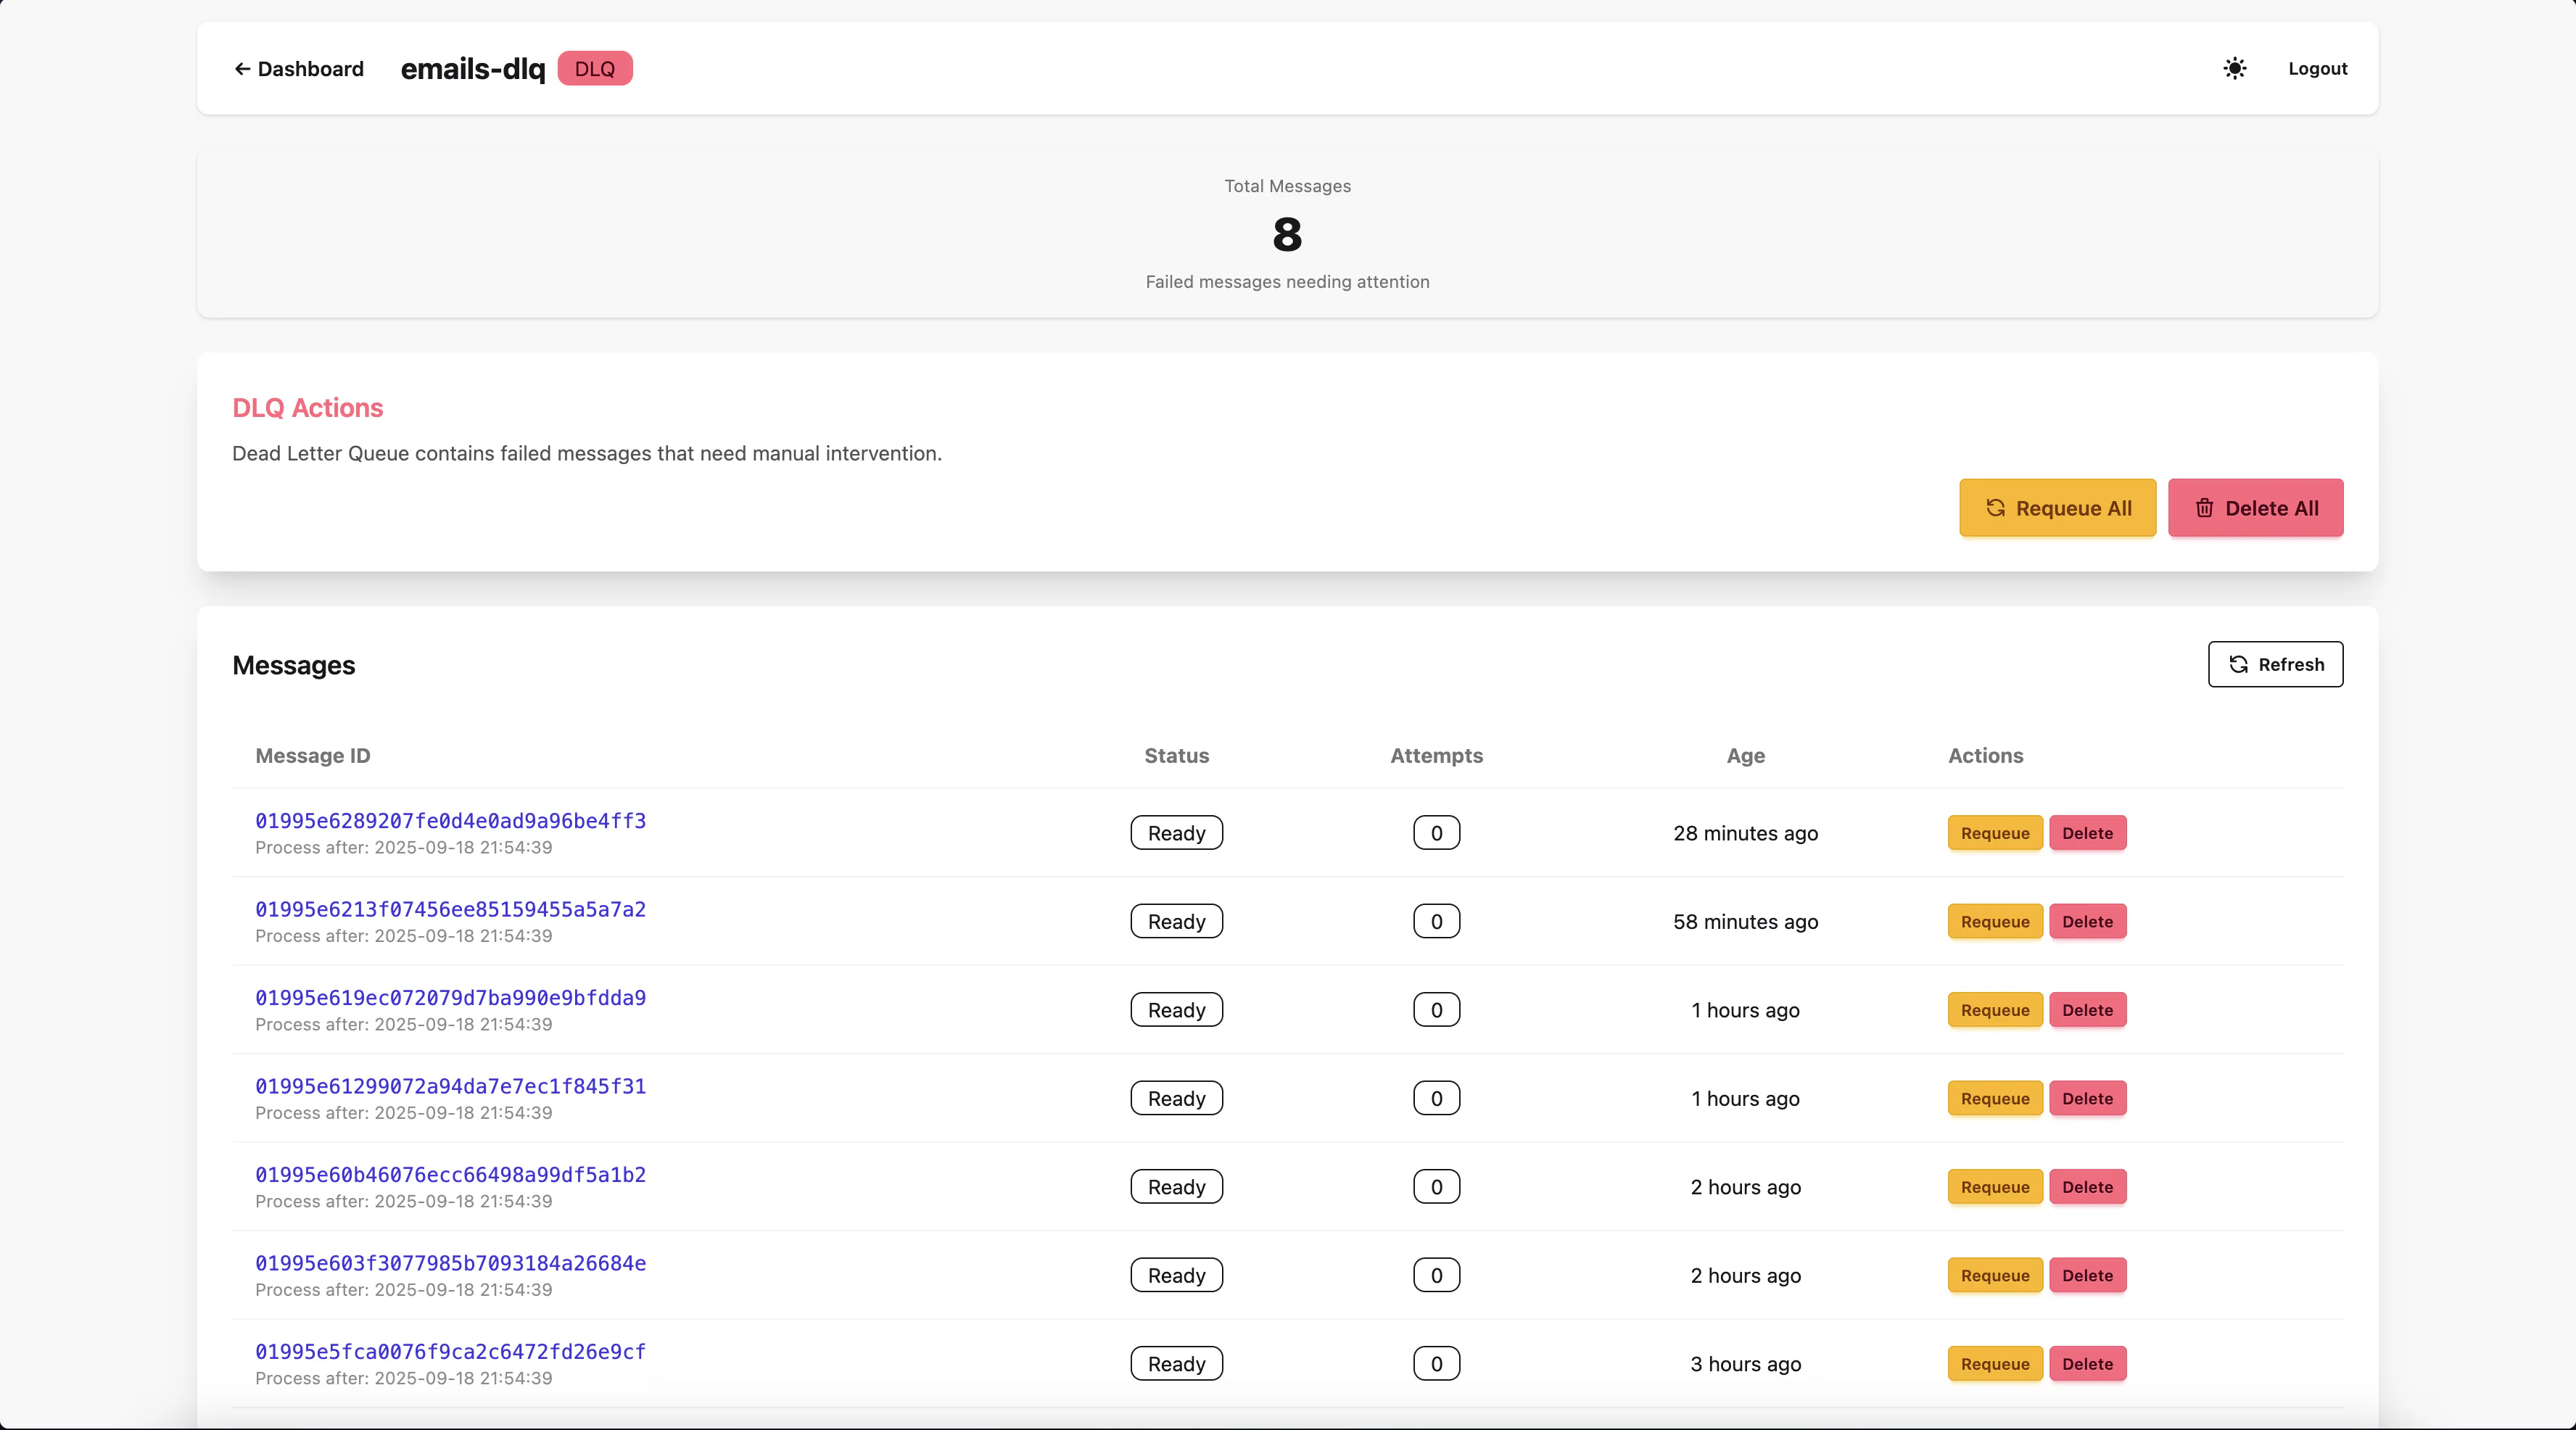
As you can see, it looks the same, except the new buttons that appear:
Requiueing a message means moving it back to the original queue with all its properties intact, except:
It’s not possible to requeue the message that is being processed at the moment.
When you click on a message ID, you will see its details:
You can see:
AS I mentioned above, the content is lazy-loaded only when you click on the message ID, to avoid loading large amounts of data unnecessarily.
You can safely view the message content, it’s not considered as “processing” the message, but rather a “peek” (in the queueing terminology).